

As coaches, we typically use our judgement to determine our lineups and substitution patterns, when in reality, simple analytics could provide more objective solutions. Data should be an aid to decision making, providing new insights and often reinforcing what we see on the court. In this article, we will look at key elements to consider when building your rotation. We’ll also introduce you to ShotTracker TEAM and share how it will give your coaching staff a competitive advantage.
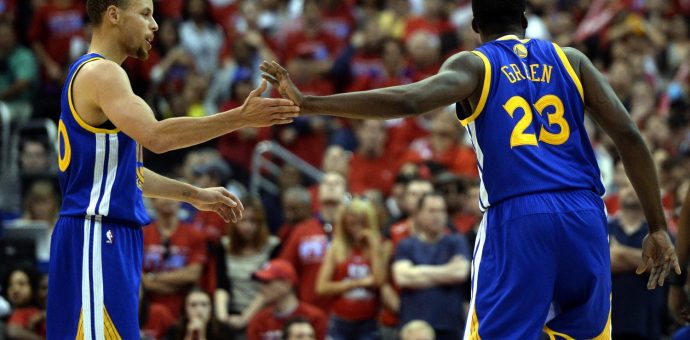
A lot of lineup talk in the NBA is about “going small”, or playing “small ball.” No one has made this look better than Steve Kerr and the Golden State Warriors. The Warriors notorious small ball or “Death Squad” lineup of Curry-Thompson-Iguodala-Barnes-Green has been the staple of the Warriors playbook, outscoring opponents by an average of .53 points per minute (as compared to an average of +.23 with their traditional “1 big” lineup during the 2015-16 season).
Before you put the brakes on your big men, here are some things to consider.
- Strength of the lineup at both ends of the court: Often times, offensive play is the only thing considered. As an example, the Warriors dominance stems from Draymond Green’s ability to be a tough match-up for a traditional 5 man lineup, but even more importantly, his versatility to guard multiple positions on defense. Never before has a 6’6” power forward been considered an elite player by averaging 14 points per game. However, when you look at simple +/- rankings of NBA players, it’s clear how valuable Green is to the Warriors.
- Passing ability: Another strength of the Warriors’ “Death Squad” lineup is the number of elite level passers in multiple positions. Tracking passes per possession and ball reversals per possession are simple stats that are often overlooked, and they can be outstanding teaching tools when coaching ball and player movement. Telling players to “move the ball more” can fall on deaf ears, when sharing correlation between passing and scoring brings the opportunity to life.
- Additional metrics: Points per possession (offense and defense), rebound rate, turnover rate, shooting %, and defensive shooting % are other statistics to look for when comparing lineup scenarios.
Rarely can a coach utilize in-season games to experiment with different lineups. Most of this happens in practice and requires additional staff. Manual data collection is often expensive, time-consuming, not delivered in real-time and is often unreliable. That’s where ShotTracker comes in. Our latest product, ShotTracker TEAM®, developed in partnership with Spalding®, captures every player’s stat for an entire team in real-time. It’s affordable for teams at all levels and doesn’t require a sensor on the wrist or on the net.
![]()
Here’s how ShotTracker TEAM works:
Each player wears a small sensor on his/her shoe, and players use the technology enabled Spalding ShotTracker ball. We permanently install sensors in the rafters above the court, which detect net locations and track the players and the balls. From there, our algorithm can calculate practically every stat based on this data supplied via the sensors.
![]()
Imagine stepping off the court after practice with full box scores, player efficiency ratings (PER), your optimal starting five, and more. Imagine your players receiving his/her own personal practice report via text… even before they leave the locker room.
We believe that analytics will change the game at all levels of play, and those who embrace it will enjoy a significant competitive advantage. For more information about our ShotTracker TEAM, visit http://shottracker.com/team