


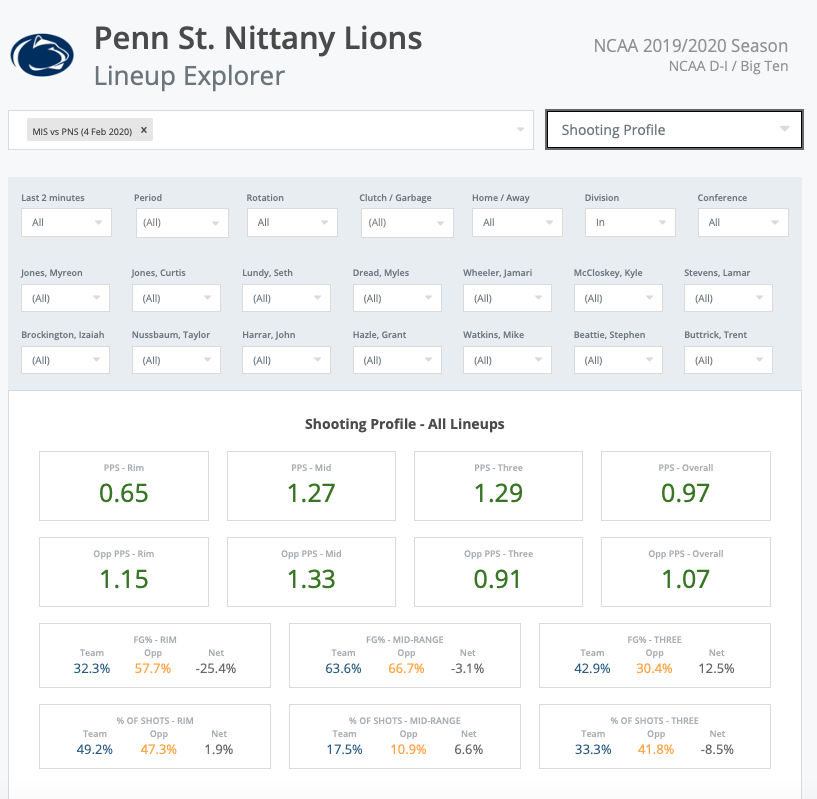
On February 4th 2020, Penn State went into East Lansing and staked their claim as one of the Big Ten’s top squads. It may not have been the prettiest win but sometimes quantity prevails over quality. PSU took eight more FGAs and six more FTAs than MSU to make up for their poor shooting performance. The differences in shot quality are also quite stark, as demonstrated by the below graphic.
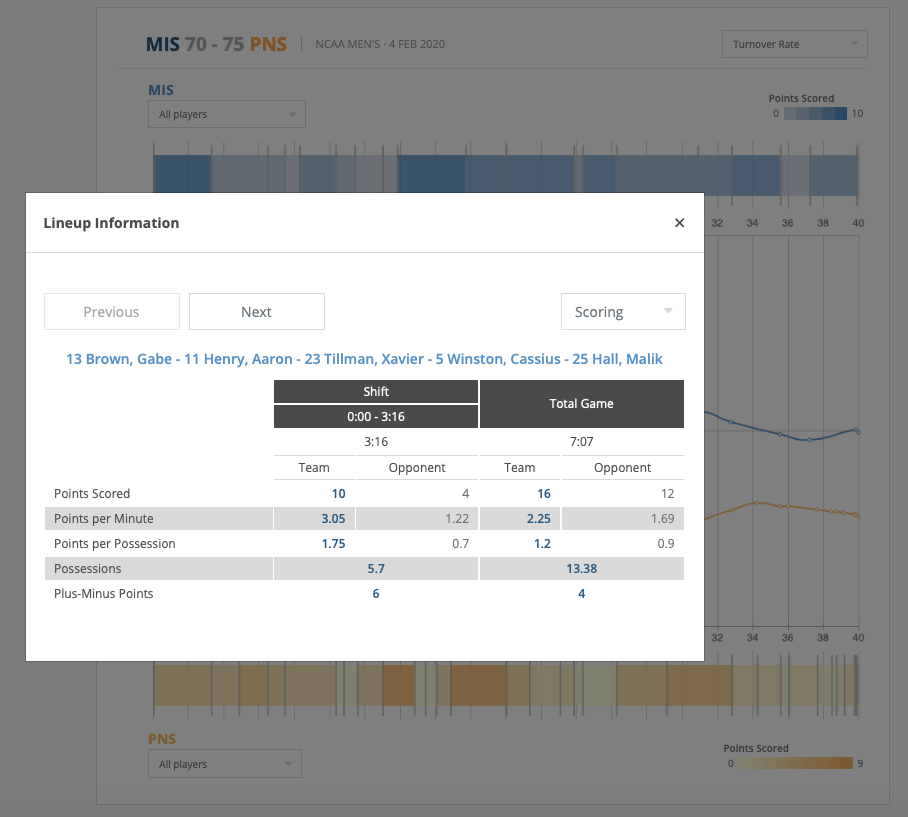
Additionally, Michigan State got off to a hot start. As their starters jumped out to a 10-4 lead, and ultimately finished +4 for the game.
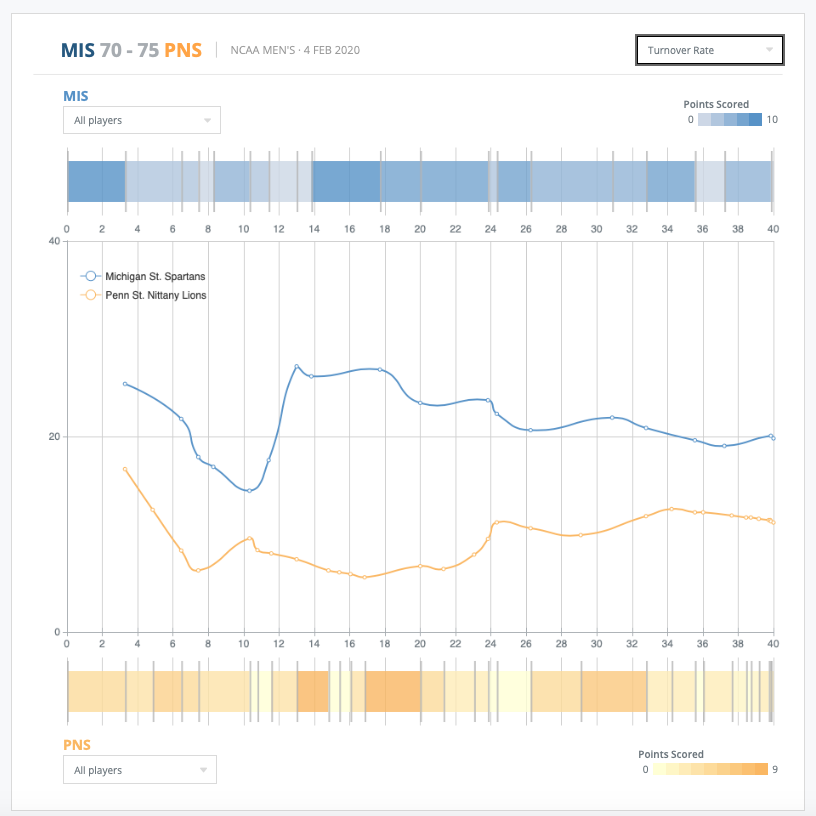
The Nittany Lions clawed their way back and eventually took the lead, in large part, due to forcing many turnovers. This shift is easily tracked when looking at the rolling turnover right for the game(see below).
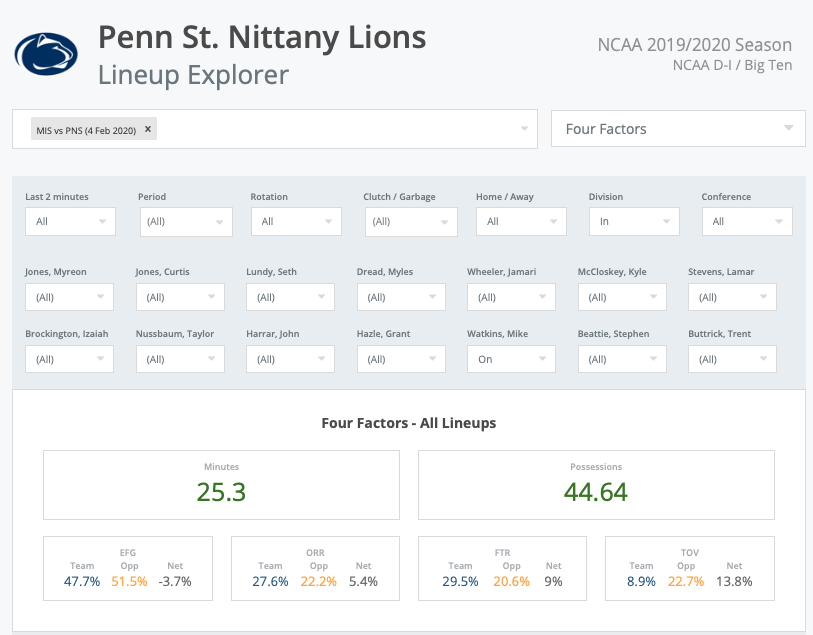
On their way to victory, Penn State made up for their poor shooting by locking down wins in the turnover margin and on the glass. This was especially true in the minutes played by Mike Watkins, who also posted a game high plus minus of +13. When Watkins was on the floor, PSU maintained a 5% rebound advantage, 14% turnover advantage, and 9% free throw rate advantage(graphic below). By winning three of the four factors during these minutes, Penn State was able to overcome their poor shooting and minimize the effects of the Spartans more efficient offense. Check out our post to learn more about the four factors.
The Four Factors and Shot Profile features provide clean and straightforward methods for analyzing the what, where, and when of a game and, when lineup data is included, the who is readily available as well. Pivot Analysis’s tools are meant to reduce the time spent preparing data and increase the time for actual analysis of games, opponents, lineups, and players. To learn more please visit our site.