There are only two ways to win a basketball game: You either make better use of your scoring opportunities or you get more chances. This is irrefutable, logical–heck, it’s just basic math.
Knowing this, the basketball world has expanded its use of advanced statistics in recent years, a trend bound to continue. We’re now tracking more stats as percentages rather than whole numbers, adjusting for pace, attempting to quantify player value, and seeking to understand more about player tendencies using math. Coaches, pundits, and fans are doing this all to answer: How can we win and why do we lose?
The Four Factors (EFG%, FT Rate, OREB%, and TO%), popularized by Dean Oliver in Basketball on Paper, are one basic way to answer this question. The Four Factors address both efficiency (EFG% and FT Rate) and extra chances (OREB% and TO%). If you do those things better than the team you’re playing, you’ll win.
Why all this background information on advanced statistics when we’re talking about Baylor? Because to understand how they won a national title, it’s important to understand that there are only two ways you can possibly win. Great teams win both ways, but this team won one way in historic fashion.
 Have a question about how the statistics in this article apply to your team? Sign up for a free 30-minute demo on our analytics tools here.
Efficiency
Let’s talk about efficiency, or more plainly, scoring as much as you can in the chances you have.
Not surprisingly, all year long, Baylor won the efficiency battle. They shot a higher percentage from two and three than their opponents in conference and non-conference by a large margin. They didn’t get to the free-throw line as much or shoot as well from the stripe as their conference opponents but only by a sliver (11.1 FTM/game to 11.6 FTM/game in Big 12 play).
So yes, in terms of efficiency throughout the regular season, they won and did so consistently. But we’re not asking how they won games during the regular season, we want to know how they won the national title. And their efficiency in the tournament wasn’t quite the same.
We could look at the tournament as a whole, but you don’t win the tournament all at once; you win it game by game. And when we break it down game by game, efficiency is not how Baylor won.
Scott Drew’s group had a higher effective field goal percentage (EFG%) than their opponents in three games (Hartford, Arkansas, and Houston), drew even in one (Wisconsin), and had a lower figure twice (Villanova and Gonzaga). The shot chart from Just Play below, which encapsulates their entire tournament run, gives you a clue as to why.
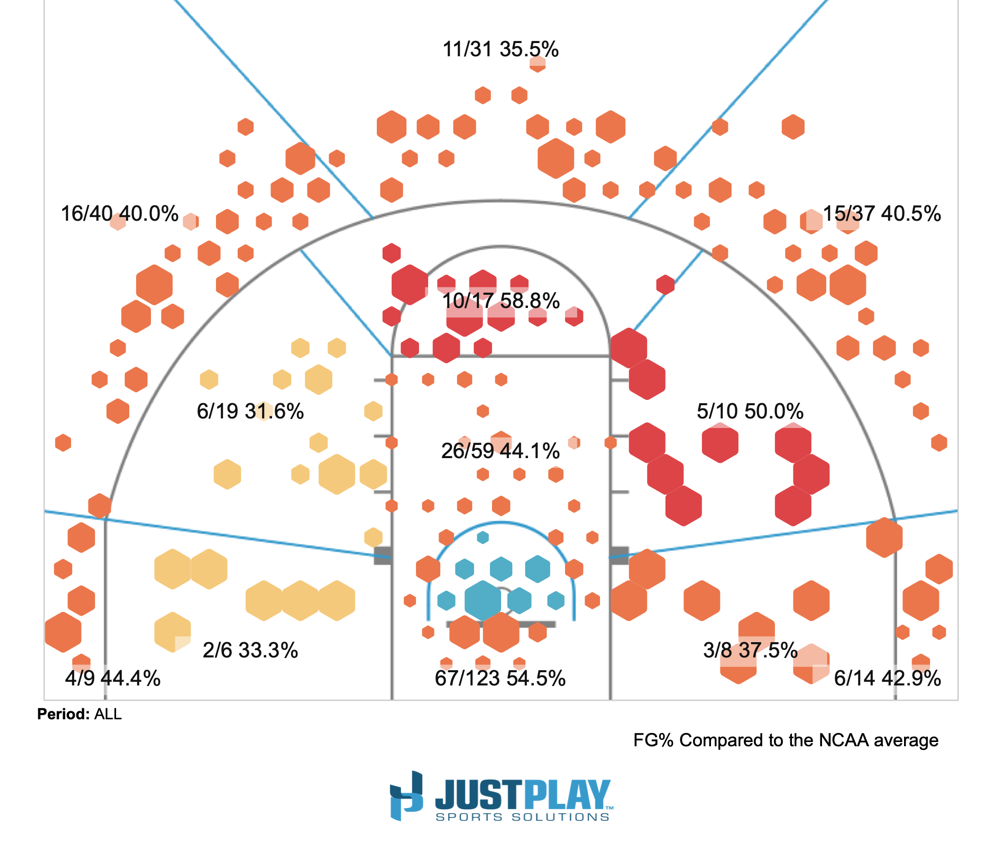
Although there are a lot of hotspots on this shot chart, there’s one area where Baylor was below average: around the rim. For shots charted in and around the restricted arc, Baylor shot 54.5%. Baylor got beat in two-point percentage in general for the tournament as a whole (51.5% to 49.6%), and this was especially the case in the games against Villanova and Gonzaga where they allowed 58.6% and 62.5% from two respectively.
But we know when it comes to efficiency that shooting percentages aren’t the only marker. We need a picture of production at the free-throw line as well to see who truly made the most of their scoring opportunities. In both games where Baylor shot the ball worse from the field (Gonzaga and Villanova), they also lost in FT Rate, which measures how often you get to the free-throw line and convert.
All of this leads us to an obvious conclusion: Efficiency is not how Baylor won. In two of their six games, they didn’t do as much with their scoring opportunities as their competition.
If scoring chances were even, Baylor would’ve lost to Villanova in the Sweet 16. And that final game they won by 16? They would’ve lost that one, too.
Extra Chances
Since Baylor didn’t make better use of their scoring opportunities than their opponents in two games, we know they must have had extra chances in those contests. But to get a truer picture of the way the Bears survived and advanced, we have to look at all six.
In terms of offensive rebounds, Baylor pulled down an average of 12.3 per game throughout the tournament and limited their opponents to 8.8. But the total number of offensive rebounds doesn’t tell us much because it doesn’t factor in the number of misses a team could’ve come up with. That’s why we use offensive rebound percentage (OREB%).
And when looking at OREB% on a game-by-game basis, Baylor lost three times. Wisconsin, Villanova, and Arkansas all got a higher percentage of their misses back.
The second factor encompassed within this category of extra chances–and the final factor within the Four Factors–is turnovers. And Baylor won in this category all six times.
Baylor turned teams over in the NCAA Tournament twice as much as they turned it over themselves. They committed an astonishingly low 47 turnovers (7.8 TO/game) while forcing 94 (15.7 TO/game). They won every game in turnover percentage, and the two games where they lost the efficiency battle, they won the turnover battle big.
To see more in-depth statistics and how to apply their use, visit Just Play’s Analytics Academy.Against Villanova, Baylor forced 16 turnovers (27.1 TO%) while giving up only six (10.5 TO%). And against Gonzaga, it was more of the same, as Baylor forced 14 turnovers (20.3 TO%) while giving up nine (13 TO%).
To get a better idea of how many extra chances Baylor had, however, we need to look at it holistically, using both offensive rebounds and turnovers. And we can do that without any percentages, just addition and subtraction, to see how many more offensive rebounds and how many fewer turnovers they had in each game.
(NOTE: We’re not using the term “Possessions” here because the formula for possessions includes offensive rebounds within them instead of splitting them out into new possessions.)
Against Hartford, Drew’s crew had seven more offensive rebounds and 14 fewer turnovers, totaling 21 extra chances. Against Wisconsin, they had the same number of offensive rebounds but 10 fewer turnovers, giving them 10 extra chances. Using the same process, we know they had 14 extra chances against Villanova and six against Arkansas. In fact, they averaged more than 11 extra chances per game throughout the tournament, something no team in recent memory has matched.
Outside of Hartford, no game was more representative of how Baylor won it all than the final against Gonzaga. Against the Zags, Baylor won by five in the turnover battle and 11 in the offensive rebound battle, allowing only five. Adding both margins together, we know Baylor had 16 more opportunities to score than Mark Few’s bunch. And it’s hard to beat someone when you spot them 16 extra chances.
What It Means
There was a clip circulating this year of Mick Cronin, in reference to intangibles, saying, “Good teams know how they win. Bad teams don’t know how they lose.” People liked and retweeted it, and the message was good. But I’d say the same is true of many coaching staffs when it comes to statistics.
The Four Factors give teams the four statistical areas (efficiency, free throws, turnovers, and rebounds) that contribute to wins and losses. For many coaching staffs, this is a good starting point. For others, however, I believe it can be even simpler. Whether you’re deciding how many guys to send to the glass, how often to press, or what to run offensively, knowing whether your intention is to be more efficient with your opportunities or get extra ones is a good place to begin.
Baylor knew how they’d win, and it showed in the national championship. They didn’t try to be more efficient than Gonzaga. They took their ball, off the glass and out of their hands, and the national title with it.
How We Got This
All I used were Just Play’s analytics tools and basic stat features to put this together. And it’s worth noting that in their run to the national title, Baylor used us, too, for their scouting, recruiting, and player learning needs. They figured out how to win using our system, and I figured out how they did it afterward using the same tools.
If you’re a college coach and you want to learn more about Just Play and how you can use our tools to figure out how to win, click here. We’d be glad to meet with you, show you how we can make your life easier, teach your players better, and win basketball games.