
This holiday week was packed with exciting Multi-Team Event (MTE) matchups, featuring a plethora of top-ranked teams. We were privileged to witness early-season favorites clash in high-caliber, competitive basketball games. Today, we’ll delve into the statistical factors that propelled two MTE champions to victory during Feast Week. Let’s uncover the details powered by Just Play.
Allstate Maui Invitational – Purdue Boilermakers
In the 40th edition of the Maui Invitational, Coach Matt Painter and the Purdue Boilermakers faced a gauntlet of ranked opponents on their way to capturing their first-ever Maui Invitational championship. They defeated #11 Gonzaga, #7 Tennessee, and #4 Marquette to claim the title.
Two key factors that helped fuel Purdue’s offensive success in the tournament were:
- Free Throw Shooting: The Boilermakers were extremely good at drawing fouls and getting to the free-throw line. They drew a foul on 32.9% of their possessions, averaging 22.3 fouls drawn in their three games. As a team, they attempted 26.3 free throws per game, with Zach Edey getting 36 attempts in those three games alone.
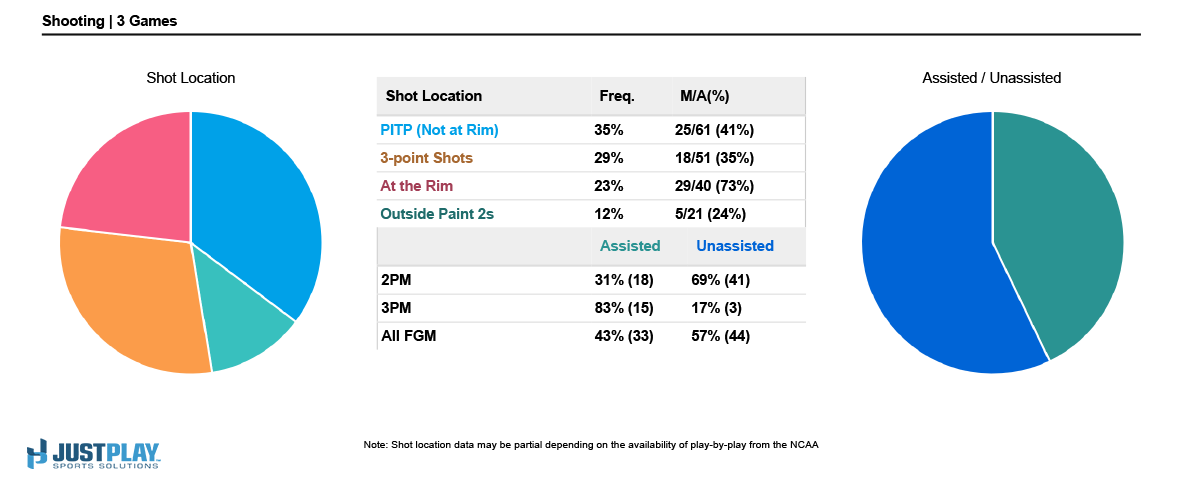
- Points in the Paint, Not at the Rim: Purdue attempted 35.3% of their shots from PIP Not ATR (Points In Paint Not At the Rim). The Boilermakers scored 22.5% of their points from inside this zone. In the half-court alone, Purdue attempted more shots in PIP Not ATR than in any other zone.
Purdue’s defensive performance was equally impressive. They stifled their opponents in several key areas:
- Limiting Free Throws: The Boilermakers prevented opponents from getting to the free-throw line, holding them to just 49 free throws over the three games. For comparison, Zach Edey shot 36 free throws himself.
- Rebounding Dominance: Purdue controlled the boards, keeping opponents to a very low rebounding percentage (44%) in their three games. This rebounding performance places them in the top 4% of teams in the country.
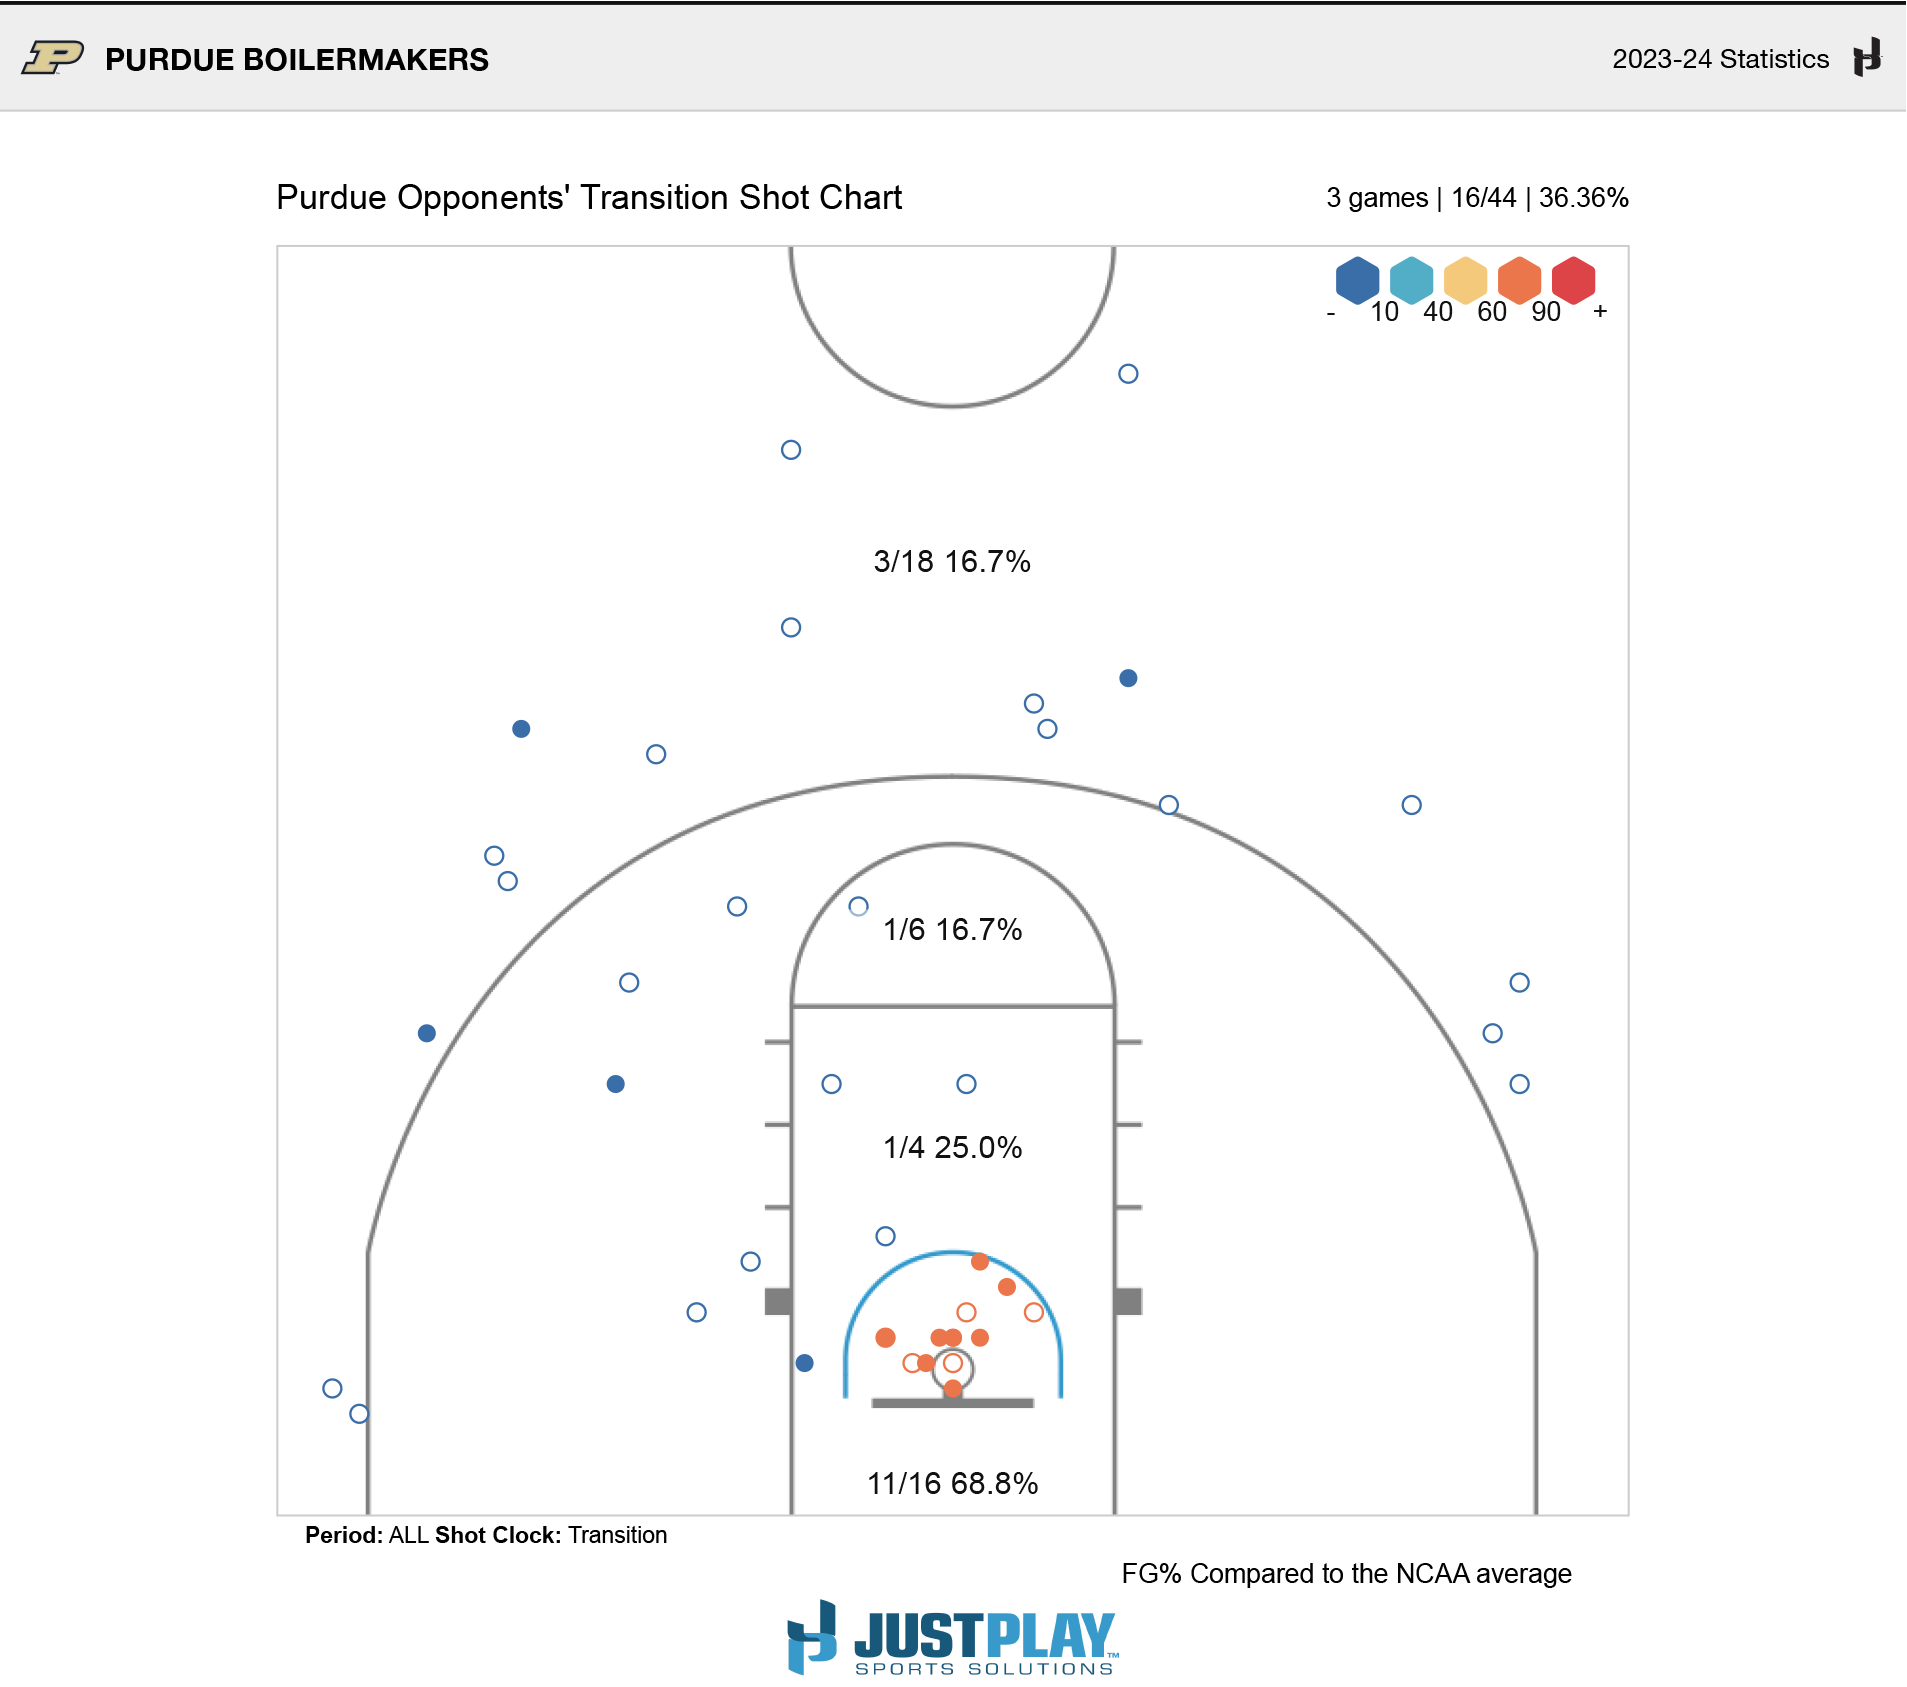
- Shutting Down Transition: Purdue effectively neutralized opponents’ transition game. Opponents shot just 36.4% from the field in transition, including an extremely low 16.7% from the 3-point line. Outside of shots at the rim, teams only scored a total of five field goals in three games.
Bad Boy Mowers Battle for Atlantis – Villanova Wildcats
Year after year, the Battle for Atlantis tournament attracts some of the nation’s top basketball teams, and this year was no different. Coach Kyle Neptune and the Villanova Wildcats faced a trio of formidable opponents in the Texas Tech Red Raiders, the #14 North Carolina Tar Heels, and the previously undefeated Memphis Tigers. Let’s examine some key offensive and defensive statistics that contributed to Villanova’s championship run.
Villanova’s offensive success hinged on three key statistics:
- Points Per Possession (PPP): The Wildcats’ overall PPP of 1.171 placed them among the top 20% in the country. Their half-court PPP (last 21.9 seconds of the shot clock) was an even more impressive 1.21, ranking them among the top 8%.
- Free Throw Shooting: Similar to Purdue’s dominance in the Maui Invitational, free throws were crucial for Villanova. They drew fouls on 31.8% of their possessions, averaging 21.7 fouls drawn per game. The Wildcats converted at a stellar 83.7% from the free-throw line, with 29.1% of their scoring coming from the charity stripe, ranking them in the top 1% in NCAA Division 1.
- Turnovers: Villanova prioritized ball protection throughout the tournament. They averaged a low 9.7 turnovers per game, turning the ball over on only 13.7% of their possessions, placing them among the top 10% of teams.
Two defensive statistics stood out as crucial to the Wildcats’ success:
- Defensive Field Goal Percentage: Villanova held their opponents to just 39.9% shooting from the field, a testament to their collective defensive effort.
- Points Per Possession (PPP): The Wildcats held their opponents to less than 1.0 PPP in four out of five categories (Transition, Half Court, Late Shot Clock, After Deadball, and After OREB). Two of these categories were particularly impressive. After a deadball, teams averaged just 0.46 PPP, and after an offensive rebound, teams averaged a low 0.87 PPP.

To learn more about Just Play and how they might be able to help you this season, click here.